Data Analysis Portfolio Project – Project Management
The business request for this project was created to overview the project management request. By deciding on a business to analyze (project management) the following user story was derived.
| # |
As a (role) |
I want (request / demand) |
So that I (user value) |
Acceptance Criteria |
| 1 |
Project |
Budget and Actual |
get the budget cost and Actual cost |
A Excel dashboard
which lets me get an
easy and quick overview |
| 2 |
Manager |
Budget and Actual |
get the date, budget and actual |
A Excel dashboard
which lets me get an
easy and quick overview |
Data Collection & Tables Structures
The necessary data were collected and structured in Excel file. The project management data was organized as a Pivot table and date & Budget, Actual were organized as dimension tables for filtering data.
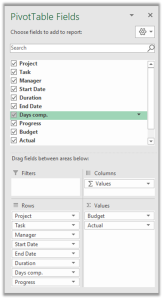
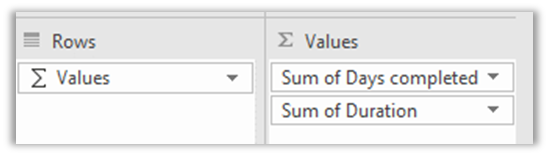
First we will create a pivot table able to insert the values, Rows
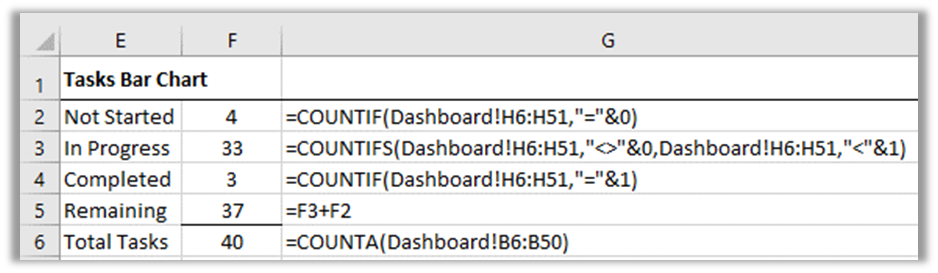
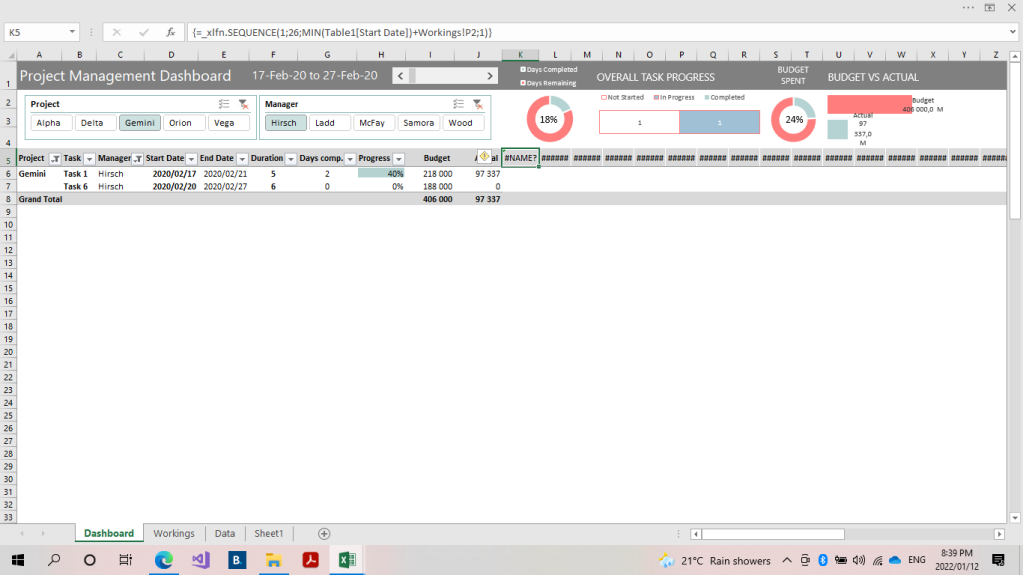
We perform some calcaletions to get the overall progress able to create a task bar chart
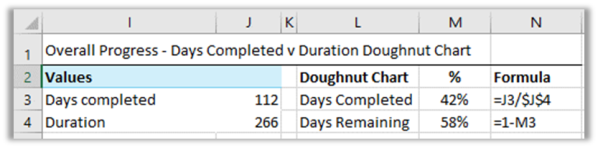
Next step we insert the doughnut chart Pivot table for Overall Completed - Completed Days vs Duration
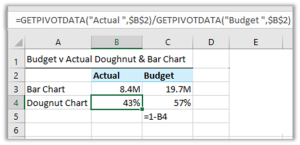
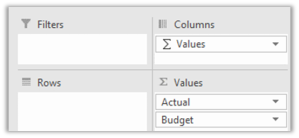
Budget vs actual doughnut & bar chart Pivot table on Workings sheet
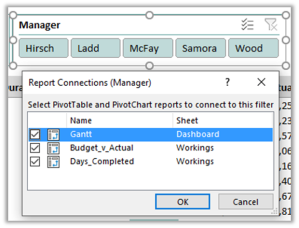
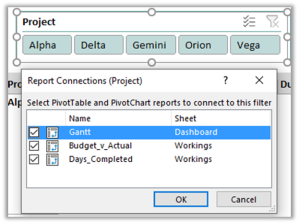
Next step insert a Slicer for Project and Manager
The finish report consists of one Dashboard. One is more of a basic version, visualizations. To enable these visualizations the calculation.
.png)
.png)
.png)